Prerequisite
Elasticsearch - FullText search engine.
Logstash - Store log data and indexing.
Get insights of input, filters and output: -
Kibana - Awesome visual dashboard.
Download ELK
Checkout Products of Elastic
Step1: Install Elasticsearch and automatically start during bootup.
Step2: Install Logstash and follow installation steps for all plugins.
Step3: Download Kibana files follow installation steps.
Complete information https://www.elastic.co/downloads
Ruby Gem
Configure the Rails environment to be monitored accordingly.
It provides an additional logger for your application in JSON format, which will be feed as input to logstash and visualised from Kibana interface.
Configure Logstash
Create a file inside Logstash directory(all plugins) which was downloaded in previous step,
quickstart.conf - set the log path of your application to be monitored.
input {
  file {
    type => "rails logs"
    path => "/home/Nithin/rails/project_name/log/logstasher.log"
    codec =>   json {
      charset => "UTF-8"
    }
  }
}

output {
  # Print each event to stdout.
  stdout {
    codec => rubydebug
  }

  elasticsearch {
    # Setting 'embedded' will run  a real elasticsearch server inside logstash.
    # This option below saves you from having to run a separate process just
    # for ElasticSearch, so you can get started quicker!
  }
}
logstasher.log will be your new log file created by logstasher gem.
Start Logstash and Kibana
Make sure logstash is up and running withsudo service logstash status/start
Start the configured logstash agent.bin/logstash agent -f quickstart.conf
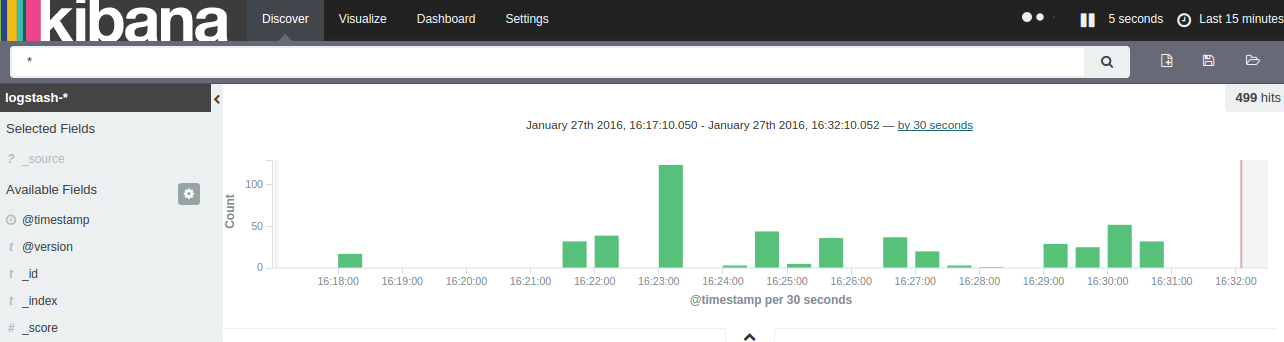
Start Kibana for Inferface and visit 0.0.0.0:5601
bin/kibana